What Is Google Status Dashboard And How Do You Access It?

With a market cap of over two trillion dollars, it's no surprise that Google has its feet firmly planted in more than a few domains. Though the company is best known for its search engine, Google provides some of the most used services worldwide, including Gmail, Google Meet, Android, and a few underrated apps like Google Tasks. With so many services under its umbrella, maintaining each is crucial given the millions of people who rely on them daily.
For a company the size of Google, it isn't every day that you notice major service outages — this would be catastrophic for both the brand and its users. Despite the robustness of Google's infrastructure, occasional service downtimes are impossible to avoid. While these disruptions are handled with utmost priority and often don't last long, it would be convenient for users to check whether a service is facing technical issues at any given time.
As it turns out, Google thought ahead and offers a way to do just that. With the Google Status Dashboard, you can glance over most of the major Google Workspace services that the company provides and view information about ongoing or previous outages.
How to access the Google Status Dashboard
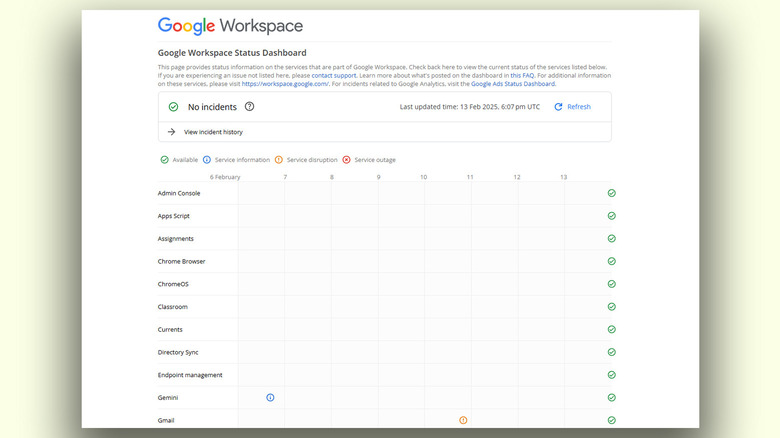
If you've been experiencing issues with accessing things like your inbox in GMail or an important document in Google Docs, the first step of action should be to discern if the problem is on Google's end or yours. Heading to the Google Workspace Status Dashboard in a web browser will allow you to confirm this. If no products are currently facing any disruptions, you will notice a big green check mark labeled "No incidents" at the top, with an option to refresh the status page.
Scrolling down will reveal several Google services — such as the Chrome browser, Gemini, Gmail, Google Calendar, Docs, and Drive, to name a few. If a specific service is facing an outage, you will spot a status indicator next to it. Here's a handy legend that explains what each status icon signifies:
- Green check mark: available with no issues
- Blue info icon: additional information about a potential issue or identified symptoms
- Orange info icon: service disruption
- Red cross mark: service outage
If you spot any info or outage icon, you can click on it to view detailed information about what's disrupting the service. The dashboard lists detailed incident reports, complete with what's causing the disruption, how Google is currently addressing the issue, and timestamps for major developments. The Google Workspace Status Dashboard lets you view incident reports from the past 365 days. This also covers certain forgotten Google services like Hangouts that have now gone inactive.
Google Status tools and how to handle outages

If a product you've been experiencing problems with is listed as disrupted on the Google Workspace Status Dashboard, it will most likely be addressed and fixed as soon as possible. You might also run into issues if Google detects unusual traffic from your end. If you suspect something is wrong with your internet or computer, going through basic troubleshooting steps like restarting your router and clearing your browser's cache can help rule out local issues.
For webmasters and SEO professionals, the similarly named Google Search Status Dashboard displays information related to the search side of things, such as the crawling, indexing, and ranking of webpages. For the most part, the regular status dashboard that Google provides should serve as a reliable indicator of disrupted services.
If there are certain products or other websites that you've been facing issues with, dedicated tools such as Downdetector can help you determine whether the issue is on your end or the website's. Downdetector works by registering complaints from actual users and is useful for identifying disruptions for practically any popular website or service.