Which Arduino Boards Support Debugging? Here's The Complete List
Even if you're a programming wizard with decades of coding experience, you're still bound to make mistakes when writing the code. Thankfully, with Arduino, there are several debugging techniques you can use to get your program up and running in no time. One of the most common ways is to go through the Arduino IDE's compiler messages to check whether there's an issue with the syntax. You can also go down more traditional routes, using trace code, where you print messages to the serial monitor, or signal through a GPIO pin that parts of your sketch run as expected. Although these techniques do a great job of solving your code issues at times, they have limitations. For instance, you can't use the serial monitor if you already have a component connected to the RX/TX pins. The extra lines of code can also interfere with how your overall program executes. And often, the compiler messages can be vague and unhelpful.
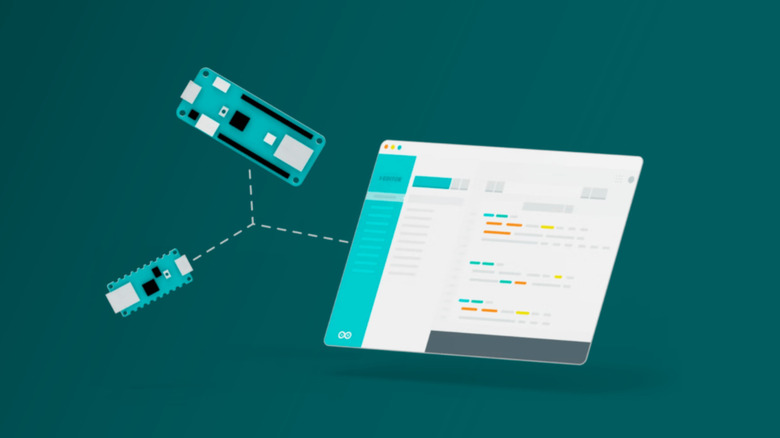
Luckily for you, Arduino offers a more straightforward alternative: the Debugger feature in the second version of its IDE. The Debugger helps you to better understand your Arduino code, and simplifies the debugging process. However, it isn't available for all Arduino boards. Here's a complete list of the only boards you can use with the Debugger feature.
Arduino boards with Arduino IDE 2 Debugger support
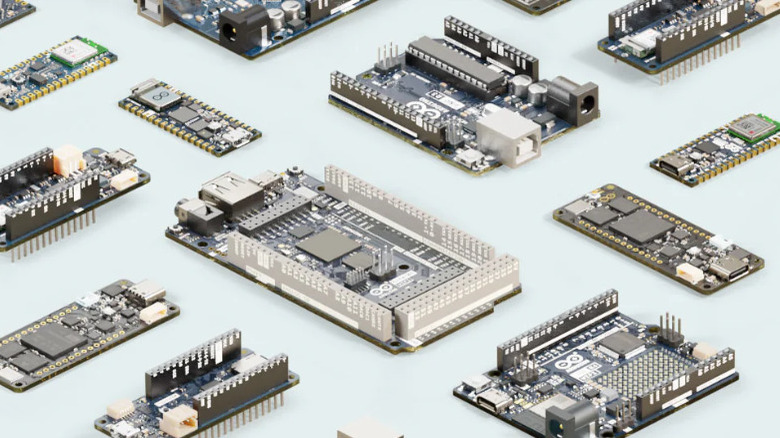
Arduino IDE 2's Debugger feature works exclusively with boards using an SAMD microcontroller. This includes the following:
- Zero: Comes in a similar form factor to the classic Uno but with upgraded features like a 32-bit microcontroller, one analog output pin, 256 KB flash memory, and an onboard hardware debugger.
- Nano 33 IoT: Equipped with Wi-Fi and Bluetooth connectivity and a six-axis inertial measurement unit (IMU) for motion tracking Arduino projects.
- MKR Zero: Different from the Arduino Zero. It's part of the small sized MKR family and features a built-in SD card connector.
- MKR WAN 1300: Integrated with a Murata CMWX1ZZABZ module for LoRa communication and supports AA and AAA batteries.
- MKR WAN 1310: A successor to the MKR WAN 1300. It's developed with a different battery charger and an external QSPI flash memory of 2 MB.
- MKR WiFi 1010: Functions just like the Nano 33 IoT but features an onboard battery connector and a larger size (61.5 mm x 25 mm vs 45 mm x 18 mm).
- MKR NB 1500: Integrated with a uBlox SARA-R410M-02B for narrowband communication over networks, such as LTE-M, NB-IoT, and EGPRS.
- MKR VIDOR 4000: Comes with a Field Programming Gate Array (FPGA) chip that can be reprogrammed to suit your hardware requirements. It can also be connected to a camera and HDMI display via its MIPI camera and micro-HDMI connectors, respectively.
- MKR FOX 1200: Designed with Sigfox connectivity for Sigfox network applications. This board has been discontinued.
- MKR GSM 1400: Includes a GSM/3G module, allowing the board to send and receive SMS messages. Arduino no longer produces this board.
Unfortunately, the more popular boards like the Uno, classic Nano, and Mega 2560 don't support the Debugger feature as they're powered by an AVR microcontroller.
How are the boards used with the Arduino IDE 2 Debugger?
To use the Debugger on the Arduino IDE 2, you generally need two hardware components: your Debugger-compatible Arduino board and a debugger probe. The probe connects to the Arduino board and allows you to thoroughly analyze the uploaded sketch while the code is executing. Arduino recommends either a Segger J-Link or Atmel-ICE debugger probe, both of which use the Serial Wire Debug (SWD) interface to communicate to your board. However, the SWD interface on the MKR and Nano boards doesn't come with pre-soldered pin headers (as it isn't typically used when you're just getting started with Arduino). That means you can't attach anything to it out of the box. You have to use a MKR Proto Shield (applicable only for MKR boards) or solder some male headers onto the board for the probe to connect to.
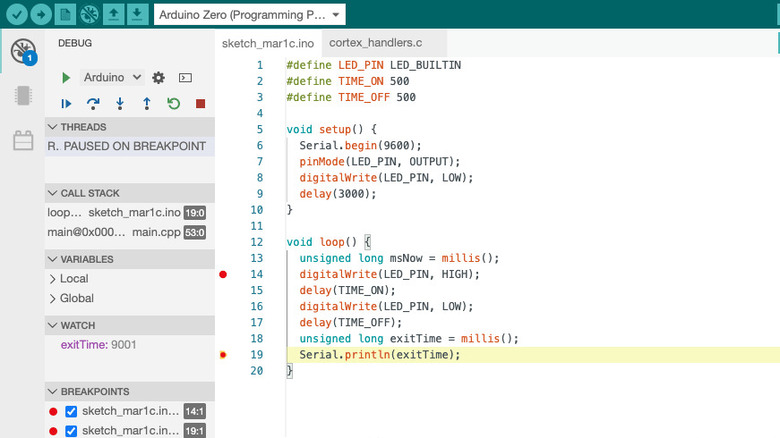
You won't have to install anything else other than the Arduino IDE 2 if you're using the Atmel-ICE probe. For the J-Link probe, however, you need the J-Link GDB Server on top of the Arduino desktop app. Once the Arduino board and your probe are connected and the necessary software is installed, you can proceed with the debugging process.
It's worth mentioning that the debugger probes are only required for MKR and Nano boards. The Arduino Zero, which is already integrated with a built-in debugger, can be used with the Arduino IDE 2 Debugger without any extra hardware. To debug this board, you simply connect it to your computer as you would normally do when uploading a code and then start the debugging process as usual.